Bitcoin (BTC) Playing Catch Up as Ethereum (ETH) Surges to Fresh Highs
BITCOIN, ETHEREUM, ETH/USD, BTC/USD, BTC/ETH RATIO – TALKING POINTS:
- The breakdown in the BTC/ETH ratio suggests Ethereum may continue outperforming Bitcoin.
- BTC poised to retest its yearly high after breaching Descending Triangle resistance.
- ETH looking to extend climb to fresh record highs after penetrating key resistance.
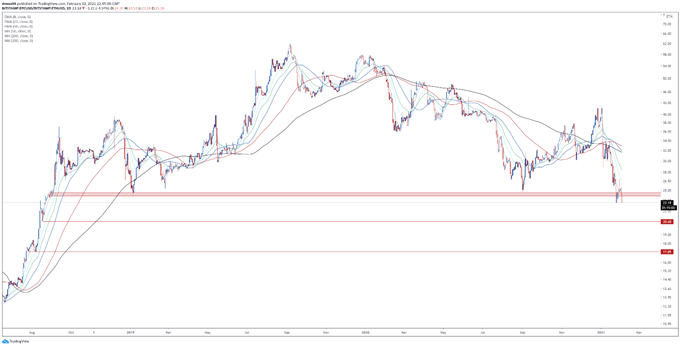
As mentioned in previous reports, the BTC/ETH ratio’s break to its lowest levels since August of 2018 suggests that Ethereum may continue to outperform Bitcoin in the short term. Indeed, this has held true in recent days as the second-most heavily trade cryptocurrency has surged to fresh record highs, while Bitcoin has stagnated above key support.
However, BTC looks set to follow ETH higher, after bursting through key resistance. Here are the key technical levels to watch in the coming weeks.
BTC/ETH RATIO DAILY CHART

BTC/ETH ratio daily chart created using Tradingview
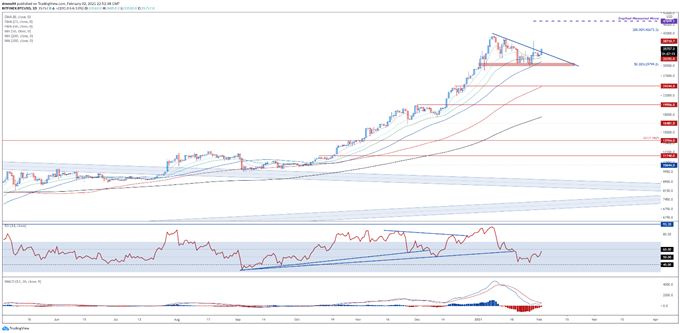
BITCOIN (BTC) DAILY CHART – DESCENDING TRIANGLE BREAK HINTS AT GAINS
Bitcoin looks poised to extend recent gains, as prices burst above Descending Triangle resistance and the psychologically imposing 35,000 mark. With the RSI eyeing a push above 60, and a bullish crossover taking place on the MACD indicator, the path of least resistance seems skewed to the topside.
Clearing the January 29 high (38711) would probably intensify near-term buying pressure and carve a path for price to challenge the yearly high (41969).Breaking that is needed to signal the resumption of the primary uptrend and pave the way for the popular cryptocurrency to fulfil the Descending Triangle’s implied measured move (47699).
Alternatively, failing to breach the 38700 mark could trigger a pullback to former resistance-turned-support at the January 2 high (33292).

BTC daily chart created using Tradingview
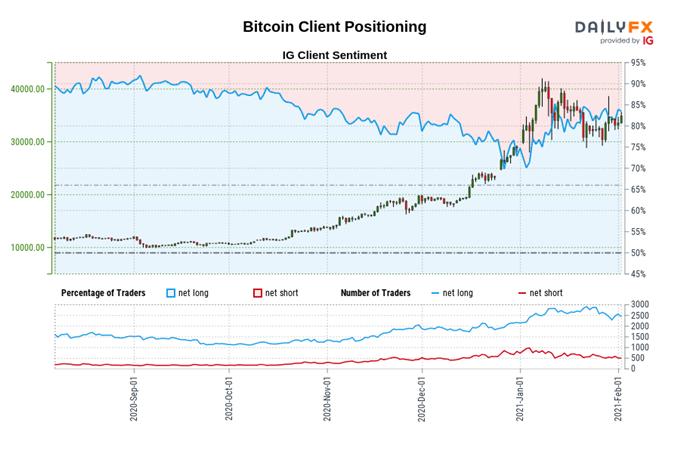
IG CLIENT SENTIMENT REPORT
The IG Client Sentiment Report shows 83.58% of traders are net-long with the ratio of traders long to short at 5.09 to 1. The number of traders net-long is 2.05% lower than yesterday and 9.82% lower from last week, while the number of traders net-short is 1.30% higher than yesterday and 9.11% lower from last week.
We typically take a contrarian view to crowd sentiment, and the fact traders are net-long suggests Bitcoin prices may continue to fall.
Yet traders are less net-long than yesterday and compared with last week. Recent changes in sentiment warn that the current Bitcoin price trend may soon reverse higher despite the fact traders remain net-long.

ETHEREUM (ETH) DAILY CHART – BREACH OF KEY RESISTANCE OPENS DOOR TO FRESH HIGHS
Ethereum also appears poised to continue its recent surge higher, after piercing through range resistance at 1400 – 1440.
A bullish crossover on the MACD indicator, in tandem with the RSI gearing up for a push into overbought territory, hints at further upside in the near term.
Hurdling the psychologically imposing 1600 mark would probably ignite a more impulsive upside push to probe the 100% Fibonacci (1726).
However, failing to breach psychological resistance could result in price pulling back to former resistance-turned0support at the 2018 high (1424).